Overview
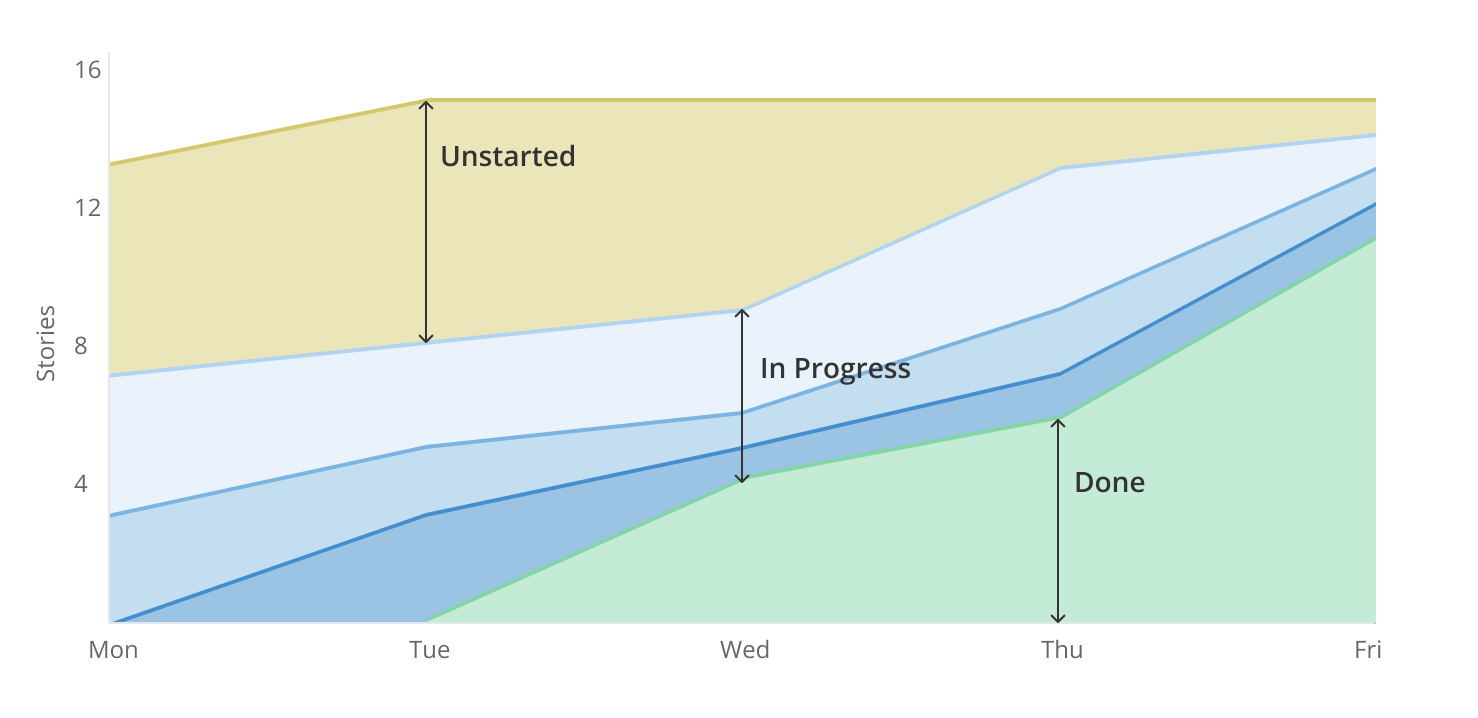
The Cumulative Flow Diagram (CFD) shows the total amount of work in each workflow state over a period of time. The CFD is a powerful tool that can be used to understand a team's workflow, increases in scope, cycle time, and throughput.
Chart Mechanics
The CFD is organized into three major groups. Each of these are expected to behave differently. It's important to understand their roles to get the most out of the CFD.

- Yellow Area: Unstarted
- Blue Area: In Progress
- Green Area: Done
Yellow Area
The yellow area represents work in any Unstarted workflow state. This area should shrink over the timeline of an iteration as stories move to In Progress, and then to Done. If this area is not shrinking, it means that work is being added at the same or higher rate as work being completed. Increases in the Unstarted area will lead to an increase in the total chart height. This is a quick way to identify a change in scope.
Blue Area
The blue area represents work in any Started workflow state. This area should maintain a relatively consistent height as work enters and leaves at a steady pace. Increases in height can indicate a team is overloaded or experiencing a bottleneck. Decrease in height may indicate there is not enough work ready for dev.
If your CFD has multiple Started states within the blue area, these can be looked at individually to further understand the stages of development. For example, a "Ready for Review" workflow state that has grown larger than the other Started states may indicate a slow-down at the PR review stage.
Green Area
The green area should always grow as this represents work that is Done. The slope of the line conveys how fast or slow work is entering a Done state. A vertical line would represent a cycle time of zero, whereas a flat line would mean no work is being completed. Changes in slope may indicate work is slowing or that a bottleneck occurred and a lot of work was delivered at once. Ideally the slope of the Done area should be consistent, indicating a steady delivery rate.
Gray Area
Depending how a team manages work, stories in the Backlog may end up in an iteration. Ideally these are moved to an Unstarted workflow state prior to the iteration to indicate they are ready. If present, the Gray Area should be slim and quickly shrink as stories move to Unstarted or Started workflow states.
Measure Cycle Time and Velocity

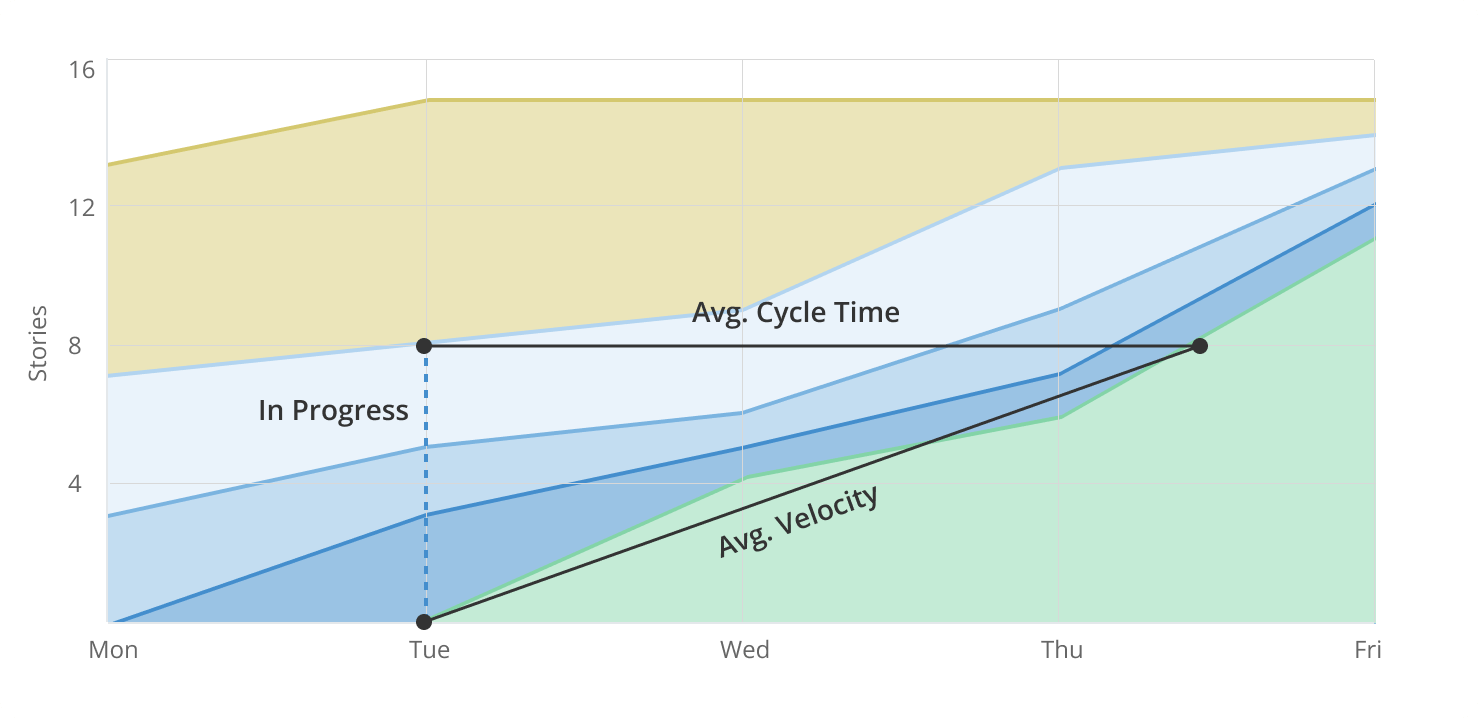
Average Cycle Time can be measured by drawing a straight line from anywhere on the top of the In Progress (blue) area to where it meets the Done (green) area. The length of this line represents the average time it takes a story to move from In Progress to Done. In the above chart, it's about 2.5 days (Tuesday + Wednesday + Half of Thursday = 2.5 days).
Average Velocity can be determined by drawing a diagonal between the dotted In Progress line and the Cycle Time line. The slope of the line shows the pace of work, and can be used to calculate velocity. In the chart above, the Cycle Time is 2.5 days, and the number of stories completed is 8, which equals a velocity of 3.2 stories per day (8 stories ÷ 2.5 days = 3.2 stories/day).
Updated