Overview
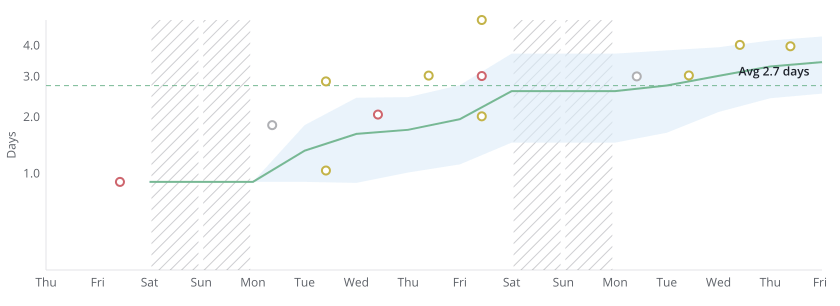
The Cycle Time report shows how long it takes to complete stories. This provides a foundation for understanding and improving team processes and delivery.
The more defined your process is for moving Stories to completed, the more accurate your data will be. For cycle time, it's important to only move work to in-progress when it's actually ready (and move it back to unstarted if needed).
Cycle Time Use Cases
Cycle Time measures how long it takes for a story to go from any Started state to any Done state.
A Story is considered started when it is first moved into a started workflow state. A Story is considered complete when it is last moved into any Done workflow state.
Work completion predictions: Cycle times allow you to look at similar projects and provide data-driven predictions on the time it will take to complete them. Lower cycle times mean you can better predict what work you can achieve. Basically, the less time it takes to do work, the better accuracy you have in that prediction.
Unstable cycle times: Chaotic or unstable cycle times can mean that team processes are not well established. This creates a good opportunity for discussion. On the other side, a stable cycle time indicates a team is working at a consistent pace, and not encountering too many disruptions.
Lead Time Use Cases
Lead Time measures the time between when a story is created and when it is completed.
Lead Time is particularly useful in bug tracking, showing how long it takes to complete bugs after they have been reported. Reducing this time means reducing the time that users are exposed to bugs.
Chart Mechanics
Note: Each tick on the x-axis represents the beginning of a day, rather than the end of a day as in Burndown and CFD. Data is not aggregated in the Cycle Time chart — this helps with viewability of the data as well as in identifying patterns.
Time Scale
The chart defaults to a logarithmic scale, which is a method for graphing and analyzing a large range of values in a compact form. This is useful for viewing cycle time data when there are outliers. For an accurate sense of scale, the linear charting method may be chosen.
Trailing Average
The Trailing Average calculation begins after the first story is completed, and accumulates for up to 7 days.
Updated
