The Iteration Detail Page can be accessed in two ways:
From the Iteration field on the Story dialog
Or, from the Iterations list page, by clicking on the Name of the Iteration
At the top of the Iteration Detail Page, you'll find the Iteration's Name along with the Description field.
On the top right, you'll see the:
-
Iteration ID (click to copy)
-
State (Unstarted, Started, Done)
-
Your Iteration will automatically move from Unstarted to Started when the Start date of your Iteration arrives.
-
- Team (select Team that owns the Iteration)
-
Date Range (Start and End Dates)
Iteration Insights
Hit your Iteration goals with at-a-glance versions of your Burndown and Cumulative Flow reports to quickly understand how work is progressing, identify bottlenecks in the process, and if you'll meet your commitments. Read more about Iteration Insights -->
Linking to a Doc
- Open the Iteration you wish to link.
- Click the "Link Doc to Iteration" option.
- Search for the Doc you would like to link
- Choose the Doc and it will be added as relationship on the Iteration detail page
-
- Note: Linking from an Iteration will create a Relationship in the Doc as well.
-
Grouping and Sorting on the Iteration Detail Page
Sorting
Click the Column Headers in the Story table to sort the Stories by that column value.
Grouping
Use the "Group By" drop-down menu to group Stories by value.
Iteration Reports
Scroll down to the bottom of the page, or click the Reports tab on the right to hop to the Report view, where you'll see a Burndown Chart of how your Stories in the Iteration are progressing.
Iteration Burndown Chart
The Iteration Burndown Chart is a graphical representation and projection of remaining unfinished work in that Iteration. See Iteration Burndown Chart for a complete walk-through of Iteration Burndown Chart features.
Iteration Cumulative Flow Diagram
The x-axis of the Cumulative Flow Diagram represents time from Iteration's start date to today's date, while the y-axis measures the number of Stories in the Iteration and how the number of Stories in each Workflow State has grown/shrunk. The x-axis will start at the date when the Iteration was created.
If the range ends up being more than 183 days, we switch the interval to weeks, and if the range is more than 730 days we switch to months.
As Workflow States are unique for each Workflow, only one Workflow can be viewed at a time. This can be selected in the workflow dropdown.
Sum Using drop down can be used to display the work completed in points or in the number of stories. This setting will override your current Estimate Scale default (Setting > Estimate Scale) for just this report.
Iteration Cycle Time Chart

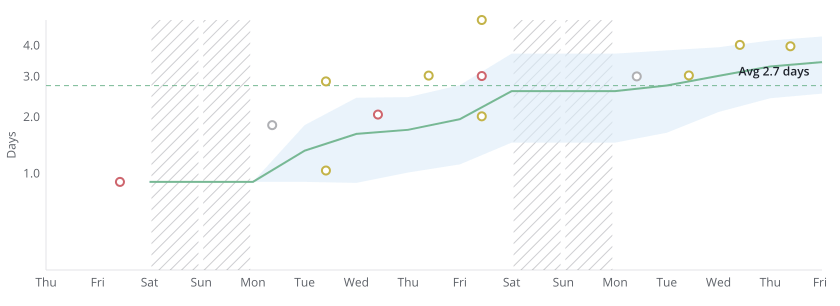
The Cycle Time report shows how long it takes to complete stories. This provides a foundation for understanding and improving team processes and delivery. See Iteration Cycle Time Chart for a complete walk-through of Iteration Cycle Time Chart features.
Want to see Iterations in action?
Explore our Sample Workspace, which contains pre-filled information that will allow you to see how it all works together. Access it by clicking Help in the top-right, and then Demo Workspace.
Updated