The Time Spent in Workflow State chart shows how long completed stories spent in each Workflow State. As Workflow States are unique for each Workflow, only one Workflow can be viewed at a time.
The x-axis represents time; the intervals can be changed by using the Group By filter at the top of the Reports page.
Note
Group By Iteration is not supported by this chart.
How 'Group By' changes the Time Spent in Workflow State Chart
When the Group By is set to Day, all stories completed that day and the previous 6 days will be included in the calculation. This allows for a trending calculation to help smooth out daily fluctuations.
When the Group By is set to Week, all stories completed that week and the previous 6 days will be included in the calculation. This is 13 days in total and will further smooth the trend lines.
When the Group By is set to Month, all stories completed in that month will be included in the calculation. This should be the smoothest trend line overall and will help you see if your team is making consistent, long term improvements in how work progresses.
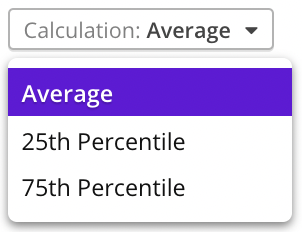
Chart Calculation Types

Average
The average, also known as the mean, is the most popular way to measure central tendency. We take all the completed stories in that interval, and sum the total time spent in each workflow state and divide by the number of stories in that state.
25th Percentile
For each workflow state, we put all the stories needed for that interval's calculation in order from least time spent in that state to most time, and then we take the first 25% of stories, and use time to calculate the time spent in that state. These stories represent the best-performing stories and thus this calculation can be thought of as the peak-performance for your team.
75th Percentile
The 75th percentile calculation is the opposite of the 25th percentile calculation. For each workflow state, we put all the stories needed for that interval's calculation in order from least time spent in that state to most time, and then we take the last 25% of stories (ignoring the first 75%), and use time to calculate the time spent in that state. These stories represent the worst-performing stories and thus this calculation can be thought of as the worst-performance for your team.
Updated